



广告
加载中

用数据解读万圣节季:Adjust 2026 年万圣节应用趋势分析

龚作仁 2026-10-27 13:15
龚作仁 2026/10/27 13:15

邦小白快读

EN
全文速览

总1 文章给出万圣节季关键时间与市场数据,实操可抓节前周末和万圣节当晚。

1. 节前内容热度从7至8月增22%,9月增25%,10月增58%;美国49%的人10月前筹备,74%计划庆祝,消费预计135亿美元。

2. 娱乐类安装峰值在10月25日增42%、10月26日增44%,流媒体10月25日安装高于基准120%、同比300%。

总2 分应用和地区看,照片视频会话峰值在万圣节当天,营销要按市场定时。

1. 照片视频万圣节当天全球平均增6%,加拿大15%、德国13%、英国11%、美国9%、墨西哥7%。

2. 墨西哥万圣节周末会话增61%和63%,安装11月2日亡灵节激增219%。

3. 实操可把推送、应用内事件、付费素材集中在当晚前后,并用实时监测识别峰值、转移预算、按市场分组发送消息。

总1 消费趋势显示万圣节营销窗口提前且消费创新高,品牌应提早布局。

1. 公开互联网万圣节内容查看量7至8月增22%,9月增25%,10月增58%;美国49%消费者10月前筹备,74%参与庆祝,消费额预计135亿美元。

2. 用户行为呈现场景差异:娱乐类安装集中在节前周末,照片视频会话集中在万圣节当天,流媒体应季节目带动观看。

总2 品牌营销要按应用类别和市场峰值安排渠道与素材,借实时工具提升转化。

1. 流媒体平台用Huluween、FearFest等应季节目,恐怖片观看份额逐年攀升,42%美国人把看恐怖片列为庆祝方式。

2. 美国英国10月25日达峰,德国10月26日,加拿大11月2日再达537%,全球同一天发送会错过市场。

3. 可在万圣节当晚集中推送通知、应用内事件和付费素材,用Pulse识别增长信号、按市场分组,用TrueLink引导至活动促销,用AI询问市场激增和安装转会话。

总1 文章显示万圣节消费需求提前释放并创新高,增长市场和应用类别有机会。

1. 美国万圣节消费预计135亿美元,高于去年131亿;74%计划庆祝,49%在10月前筹备,内容查看量7至8月增22%、9月增25%、10月增58%。

2. 娱乐类安装10月25日增42%、10月26日增44%;流媒体10月25日安装高于基准120%、同比300%;照片视频会话万圣节当天全球增6%。

总2 卖家需按市场峰值和节后延续安排投放,文章给出机会与风险提示。

1. 机会市场:美国英国10月25日峰值,德国10月26日,加拿大11月2日增537%,墨西哥万圣节周末会话增61%和63%、亡灵节安装增219%。

2. 风险提示:各市场峰值日期不同,全球统一同一天发送至少错过一个市场;照片视频会话节后三四天回落。

3. 可学习点:把推送、应用内事件、付费素材集中在峰值前后,用Pulse实时识别信号、受众群体按市场划分、TrueLink引导活动促销、AI查询激增市场和安装转会话。

总1 万圣节相关应用行为变化反映拍摄分享、流媒体应季内容和跨市场备货营销节奏需求。

1. 照片与视频类应用会话在万圣节当天升至15%,为时段单日最高,随后三、四天回落至8至10%;加拿大、德国、英国、美国、墨西哥当天分别增15%、13%、11%、9%、7%。

2. 墨西哥会话在10月31日增61%、11月1日增63%,安装11月2日亡灵节增219%,说明节庆拍摄分享需求会延续。

总2 对产品设计和数字化经营启示是围绕节庆场景做内容和工具,并按市场峰值调整经营。

1. 娱乐类安装节前周末最强,10月25日增42%、10月26日增44%;流媒体10月25日安装高于基准120%、同比300%,平台用Huluween、FearFest打造应季节目。

2. 工厂可关注万圣节装扮照片、短视频分享、流媒体内容消费带来的产品与内容需求,推进数字化时按市场峰值安排上新、素材和活动。

3. 文章提示全球峰值不同,德国10月26日、加拿大11月2日、墨西哥延续至亡灵节,统一节奏会错过市场;可用实时监测和AI辅助判断。

总1 文章呈现万圣节营销季的行业趋势和客户痛点,核心是峰值跨市场不同且机会延至节后。

1. 趋势:万圣节内容查看量7至8月增22%、9月增25%、10月增58%;美国消费预计135亿美元;娱乐类安装节前周末激增,流媒体10月25日安装高于基准120%、同比300%。

2. 痛点:美国英国10月25日达峰,德国10月26日,加拿大11月2日增537%,墨西哥延续至亡灵节;全球统一同一天发送会错过市场,照片视频会话节后三四天回落。

总2 Adjust给出实时监测、受众分组、深链和AI解决方案,服务商可据此设计客户方案。

1. 用Pulse实时识别照片视频会话增长信号,用受众群体按市场划分当晚用户,趁窗口未关闭发送消息。

2. 用TrueLink把用户引导至专为当晚打造的活动或促销,适配墨西哥节后延续亡灵节的市场。

3. 用Adjust的AI解决方案直接询问推广活动,如哪个市场刚开始激增、昨晚安装中有多少今天显示为会话。

总1 文章显示流媒体和娱乐类平台在万圣节季迎来安装和会话增长,平台需按市场安排应季运营。

1. 娱乐类安装10月25日增42%、10月26日增44%,当月同比10月25日增130%、10月26日增100%;流媒体10月25日安装高于基准120%、同比300%。

2. 平台最新做法是紧扣万圣节周打造应季节目,如Hulu的Huluween和AMC的FearFest;恐怖片观看份额逐年攀升,42%美国人把看恐怖片列为庆祝方式。

总2 平台运营要解决全球峰值不同的问题,并通过监测和活动安排规避错过窗口。

1. 市场峰值:美国英国10月25日,德国10月26日,加拿大10月25日增342%、11月2日增537%,墨西哥万圣节周末会话增61%和63%、亡灵节安装增219%。

2. 运营管理:全球统一同一天发送至少错过一个市场,应查看各市场安装和会话实际峰值并转移预算;万圣节当晚集中推送通知、应用内事件和付费素材。

3. 可借助Pulse实时识别信号、受众群体按市场划分用户、TrueLink引导活动促销、AI查询市场激增和安装转会话。

总1 文章提供万圣节消费提前、应用行为峰值跨类别和跨市场差异的产业新动向。

1. 消费端:美国49%的人10月前筹备,高于十年前34%;74%计划庆祝,高于疫情前68%;消费预计135亿美元,高于去年131亿;公开互联网内容查看量7至8月增22%、9月增25%、10月增58%。

2. 应用端:娱乐类安装节前周末最强,10月25日增42%、10月26日增44%,流媒体10月25日安装高于基准120%、同比300%;照片视频会话万圣节当天全球增6%,节后三四天回落。

总2 研究可关注营销季延长、市场异质性和实时监测商业模式,文章也提示新问题。

1. 市场异质性:美国英国10月25日达峰,德国10月26日,加拿大11月2日增537%,墨西哥万圣节周末会话增61%和63%、亡灵节安装增219%。

2. 新问题与启示:全球统一同一天发送会错过市场;万圣节机遇在10月31日前开启并在部分市场延续到节后;流媒体应季节目和恐怖片观看份额上升值得研究。

3. 商业模式:Adjust以跨渠道实时监测、Pulse、受众群体、TrueLink、AI解决方案支持预算转移和活动引导。

返回默认
声明:快读内容全程由AI生成,请注意甄别信息。如您发现问题,请发送邮件至 run@ebrun.com 。

我是 品牌商 卖家 工厂 服务商 平台商 研究者 帮我再读一遍。

Quick Summary

Summary 1 The article provides key timing and market data for the Halloween season, with practical opportunities around the pre-Halloween weekend and Halloween night.

1. Pre-holiday content engagement rose 22% from July to August, 25% in September, and 58% in October; 49% of people in the US prepare before October, 74% plan to celebrate, and spending is projected at $13.5 billion.

2. Entertainment app installs peaked with a 42% increase on October 25 and 44% on October 26; streaming installs on October 25 were 120% above baseline and 300% year over year.

Summary 2 By app category and region, photo and video sessions peak on Halloween itself, so marketing should be timed by market.

1. Photo and video sessions on Halloween rose 6% globally on average, with Canada up 15%, Germany 13%, the UK 11%, the US 9%, and Mexico 7%.

2. In Mexico, sessions rose 61% and 63% during the Halloween weekend, and installs surged 219% on November 2 for Day of the Dead.

3. In practice, push notifications, in-app events, and paid creatives can be concentrated around Halloween night, with real-time monitoring used to identify peaks, shift budgets, and send messages by market group.

Summary 1 Consumer trends show that the Halloween marketing window starts earlier and spending has reached a new high, so brands should plan ahead.

1. Halloween content views on the open internet rose 22% from July to August, 25% in September, and 58% in October; 49% of US consumers prepare before October, 74% participate in celebrations, and spending is projected at $13.5 billion.

2. User behavior varies by scenario: entertainment installs concentrate in the pre-Halloween weekend, photo and video sessions concentrate on Halloween itself, and streaming seasonal programming drives viewing.

Summary 2 Brand marketing should align channels and creative with app categories and market peaks, and use real-time tools to improve conversion.

1. Streaming platforms use seasonal programming such as Huluween and FearFest; the share of horror viewing has risen year after year, and 42% of Americans list watching horror films as a way to celebrate.

2. The US and UK peak on October 25, Germany on October 26, and Canada reaches another peak of 537% on November 2; sending globally on a single day would miss markets.

3. Brands can concentrate push notifications, in-app events, and paid creatives on Halloween night, use Pulse to identify growth signals and group by market, use TrueLink to guide users to campaign promotions, and use AI to ask about market surges and install-to-session conversion.

Summary 1 The article shows that Halloween consumer demand is being released earlier and has hit a new high, creating opportunities in growth markets and app categories.

1. US Halloween spending is projected at $13.5 billion, up from $13.1 billion last year; 74% plan to celebrate, 49% prepare before October, and content views rose 22% from July to August, 25% in September, and 58% in October.

2. Entertainment installs rose 42% on October 25 and 44% on October 26; streaming installs on October 25 were 120% above baseline and 300% year over year; photo and video sessions rose 6% globally on Halloween.

Summary 2 Sellers should schedule campaigns around market peaks and post-holiday continuation; the article highlights opportunities and risks.

1. Opportunity markets: the US and UK peak on October 25, Germany on October 26, Canada rises 537% on November 2, and Mexico sees sessions rise 61% and 63% during the Halloween weekend and installs rise 219% for Day of the Dead.

2. Risk note: peak dates differ by market, so a single global send day would miss at least one market; photo and video sessions decline three to four days after the holiday.

3. Key lessons: concentrate push notifications, in-app events, and paid creatives around peak periods; use Pulse for real-time signal identification, audience segments by market, TrueLink to guide campaign promotions, and AI to query surging markets and install-to-session conversion.

Summary 1 Changes in Halloween-related app behavior reflect demand for photo and video sharing, seasonal streaming content, and cross-market stocking and marketing rhythm.

1. Photo and video app sessions rose 15% on Halloween, the highest single day in the period, then fell to 8–10% over the following three to four days; Canada, Germany, the UK, the US, and Mexico rose 15%, 13%, 11%, 9%, and 7%, respectively, on that day.

2. In Mexico, sessions rose 61% on October 31 and 63% on November 1, and installs rose 219% on November 2 for Day of the Dead, indicating that holiday photo-sharing demand continues.

Summary 2 The implications for product design and digital operations are to build content and tools around holiday scenarios and adjust operations by market peak.

1. Entertainment installs are strongest in the pre-Halloween weekend, up 42% on October 25 and 44% on October 26; streaming installs on October 25 were 120% above baseline and 300% year over year, with platforms using Huluween and FearFest to create seasonal programming.

2. Factories can watch for product and content demand driven by Halloween costume photos, short-video sharing, and streaming content consumption, and align launches, creative, and campaigns with market peaks when advancing digitalization.

3. The article notes that global peaks differ: Germany on October 26, Canada on November 2, and Mexico extending through Day of the Dead; a uniform rhythm would miss markets, and real-time monitoring and AI can help with judgment.

Summary 1 The article presents industry trends and customer pain points for the Halloween marketing season, centered on peaks that differ across markets and opportunities that extend beyond the holiday.

1. Trends: Halloween content views rose 22% from July to August, 25% in September, and 58% in October; US spending is projected at $13.5 billion; entertainment installs surge in the pre-Halloween weekend, and streaming installs on October 25 were 120% above baseline and 300% year over year.

2. Pain points: the US and UK peak on October 25, Germany on October 26, Canada rises 537% on November 2, and Mexico extends through Day of the Dead; a single global send day would miss markets, and photo and video sessions decline three to four days after the holiday.

Summary 2 Adjust provides real-time monitoring, audience segmentation, deep links, and AI solutions, which service providers can use to design client solutions.

1. Use Pulse to identify photo and video session growth signals in real time, use audience segments to divide Halloween-night users by market, and send messages before the window closes.

2. Use TrueLink to guide users to campaigns or promotions built specifically for Halloween night, suited to markets such as Mexico where activity extends through Day of the Dead.

3. Use Adjust's AI solutions to ask directly about campaigns, such as which market has just begun to surge and how many of last night's installs are showing as sessions today.

Summary 1 The article shows that streaming and entertainment platforms see install and session growth during the Halloween season, and platforms need to arrange seasonal operations by market.

1. Entertainment installs rose 42% on October 25 and 44% on October 26; within the month, year-over-year growth was 130% on October 25 and 100% on October 26; streaming installs on October 25 were 120% above baseline and 300% year over year.

2. The latest platform approach is to build seasonal programming around Halloween week, such as Hulu's Huluween and AMC's FearFest; the share of horror viewing has risen year after year, and 42% of Americans list watching horror films as a way to celebrate.

Summary 2 Platform operations need to address differing global peaks and use monitoring and campaign scheduling to avoid missing windows.

1. Market peaks: the US and UK on October 25, Germany on October 26, Canada up 342% on October 25 and 537% on November 2, Mexico sessions up 61% and 63% during the Halloween weekend and installs up 219% for Day of the Dead.

2. Operations management: a single global send day would miss at least one market; platforms should review actual install and session peaks by market and shift budgets, and concentrate push notifications, in-app events, and paid creatives on Halloween night.

3. They can use Pulse for real-time signal identification, audience segments to divide users by market, TrueLink to guide campaign promotions, and AI to query market surges and install-to-session conversion.

Summary 1 The article provides new industry developments on earlier Halloween spending and cross-category, cross-market differences in app behavior peaks.

1. Consumer side: 49% of people in the US prepare before October, up from 34% a decade ago; 74% plan to celebrate, up from 68% before the pandemic; spending is projected at $13.5 billion, up from $13.1 billion last year; content views on the open internet rose 22% from July to August, 25% in September, and 58% in October.

2. App side: entertainment installs are strongest in the pre-Halloween weekend, up 42% on October 25 and 44% on October 26; streaming installs on October 25 were 120% above baseline and 300% year over year; photo and video sessions rose 6% globally on Halloween and declined three to four days after the holiday.

Summary 2 Research can focus on the lengthening marketing season, market heterogeneity, and real-time monitoring business models; the article also flags new questions.

1. Market heterogeneity: the US and UK peak on October 25, Germany on October 26, Canada rises 537% on November 2, and Mexico sees sessions rise 61% and 63% during the Halloween weekend and installs rise 219% for Day of the Dead.

2. New questions and implications: a single global send day would miss markets; Halloween opportunities begin before October 31 and extend beyond the holiday in some markets; the rise of streaming seasonal programming and horror viewing share is worth studying.

3. Business model: Adjust supports budget reallocation and campaign guidance through cross-channel real-time monitoring, Pulse, audience segments, TrueLink, and AI solutions.

Disclaimer: The "Quick Summary" content is entirely generated by AI. Please exercise discretion when interpreting the information. For issues or corrections, please email run@ebrun.com .

I am a Brand Seller Factory Service Provider Marketplace Seller Researcher Read it again.

万圣节的筹备工作早在10月之前就已开始。来自The Trade Desk的平台数据显示,万圣节相关内容在公开互联网中的查看量在节日前几个月稳步攀升:7月至8 月增长22%,到9 月又增长25%,再到10月增长58%。根据美国全国零售联合会近期针对美国消费者开展的调查,如今有49% 的人表示会在10月之前开始筹备,高于十年前的34%;今年计划参与庆祝活动的人占74%,高于疫情前的68%。美国万圣节消费额预计将达到创纪录的135亿美元,高于去年的131亿美元。

营销商知道,如今的消费者正在提早规划并花费更多。为了准确了解这种情况发生的具体地点、日期、市场和类别,我们提取了Adjust 2025年万圣节前后六周的数据。

研究方法

除非另有说明,以下各项百分比均将2025年某个指定日期的安装量或会话量,与同一细分群体在2025年 6月 1日至2025年 8月 31日期间的日均值进行比较。夏季是万圣节相关活动开始前的最后一段时期,因此可作为清晰的季前基准;同时,采用完整92天的平均值,而不是仅取某一周的数据,也有助于平滑周末高峰以及单次营销活动带来的波动。

如果直接将2025年 10月与2024年 10月进行比较,则会标注为同比 (YoY)。

两个类别在万圣节期间迎来增长

餐饮类应用会话量从周日到周四持平,随后在周五和周六晚间大幅跃升。万圣节前的那个周末是整个十周期间表现最强劲的周末之一,10月 25日会话量增长了11%,仅次于数据中单日最高值 (10月 4日的13%)。

照片与视频类应用的会话量在10月最后十天持续增加,万圣节当天升至15%,这是整个时段内单日最高值,随后在三、四天内回落至通常的8-10%。详情请参阅下文。

娱乐类应用的会话量通常每周五达到峰值、每周日回落,无论有何节日,这一规律都保持不变。10月的周五 (包括万圣节当天) 增幅为3–4%,而9 月则为8–10%。

万圣节前娱乐类应用安装量上升

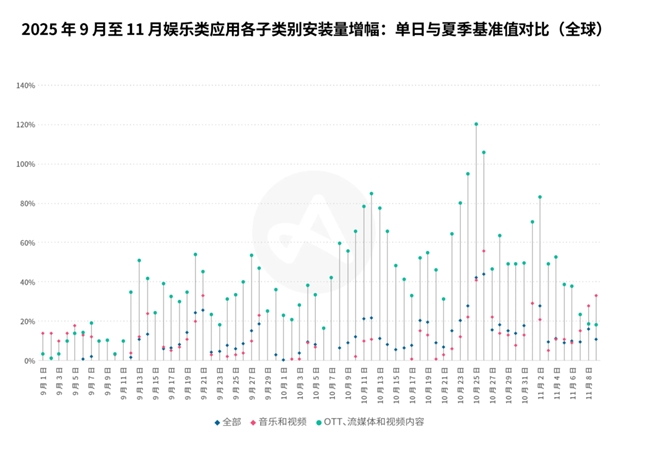
在所有娱乐类应用中,安装量在万圣节前一个周末表现最为强劲:10月 25日(周六)增长42%,10月 26日(周日)增长44%。同一时段的娱乐类应用也创下当月同比最佳表现:10月 25日的安装量较2024年同日增长130%,10月 26日增长100%。这远高于万圣节周末当天的水平:10月 31日(周五)为18%,11月 1日(周六)则为29%。

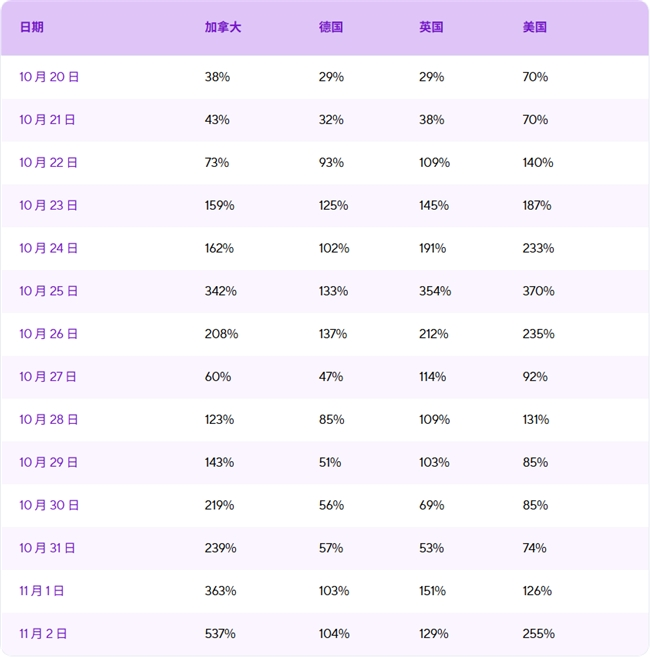
音乐与音频类应用的活跃度在后期更高,从周六的41% 攀升至周日的56%,而在万圣节当天则仅为13%。流媒体类应用的数据表现最为亮眼:仅10月 25日一天,OTT、流媒体和视频内容类应用的安装量就高于基准线120%,并在当天实现了300% 的同比增长。

流媒体平台也会紧扣这一周打造应季节目,例如Hulu的 Huluween和 AMC的 FearFest。Nielsen自身跟踪数据显示,恐怖片在总观看时长中所占的份额正逐年攀升。NRF目前已将看恐怖片列为美国人庆祝万圣节的主要方式之一 (42%,与雕刻南瓜并列),而MRI-Simmons的研究发现,大约三分之一的美国成年人会特意在Netflix、Prime Video和 Disney+ 等流媒体服务上观看恐怖片来进行庆祝。

流媒体观看高峰之夜因市场而异

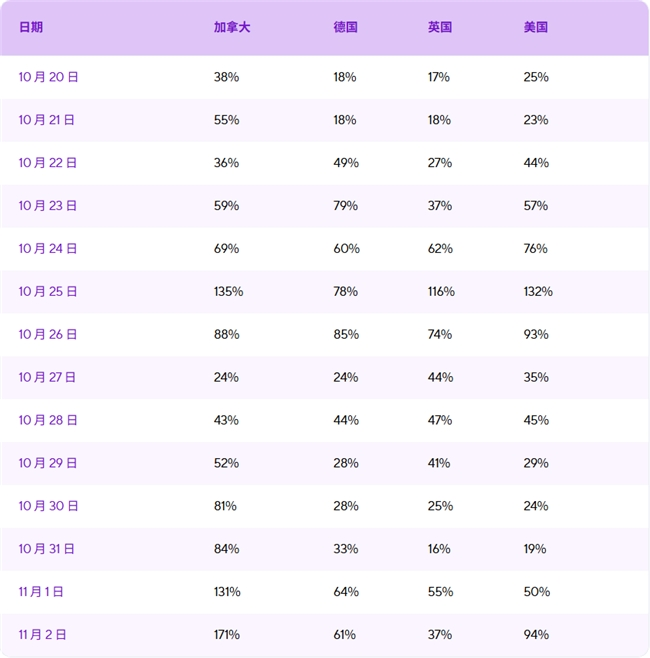
从国家/地区来看,万圣节前的周六对OTT、流媒体与视频内容类应用而言并非普遍规律。美国 (+370%) 和英国 (+354%) 均在10月 25日达到峰值。德国的最大增幅则出现在一天后的10月 26日 (+137%)。加拿大的安装量增幅在10月 25日跃升至342%,两天后回落至仅60%,随后一周再次攀升,于11月 2日达到537%。

2025年 9月至11月各国家/地区娱乐类应用安装量增幅:单日与夏季基准值对比

2025年 9月 -11月各国家/地区的OTT、流媒体与视频内容类应用安装量增幅:单日与夏季基准值对比

仅此一夜:照片与视频类应用的万圣节会话量激增

照片与视频类应用会话量并不会像娱乐类应用安装量那样向节前周末靠拢。其表现最强劲的一天正是万圣节当天。为了准确衡量这一增幅,我们将万圣节当天的会话量与此前四个周五的中位数进行了对比。我们之所以选择周五,是因为2025年万圣节恰逢周五,这样便能将万圣节效应与每款应用都会经历的常规周末增幅隔离开来。

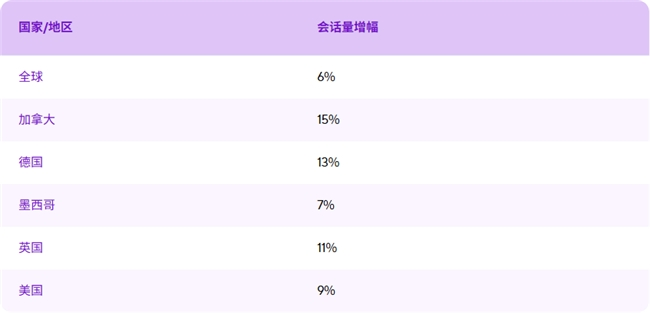
2025年各国照片与视频类应用会话量增幅:万圣节当天与此前四个周五中位数对比

与普通周五相比,万圣节当天加拿大、德国、英国、美国和墨西哥的会话量分别增长15%、13%、11%、9% 和7%,均高于6% 的全球平均增幅。推送通知、应用内事件和付费素材都适合集中安排在那一晚前后。

墨西哥是一个值得关注的例外,因为当地的万圣节装扮照片热潮会紧接着迎来11月 1日至2 日的亡灵节,为照片与视频类应用带来连续两个夜晚的会话量高峰。

额外收获:墨西哥的会话量在万圣节周末达到峰值。与夏季基准值相比,10月 31日(周五)增长了61%,11月 1日(周六)增长了63%。安装量的增长则略微滞后,在11月 2日(周日)亡灵节期间激增219%。

实时监测万圣节季的表现

万圣节在日历上只有一天,但数据显示,机遇早在10月 31日之前就已开启,并且在某些市场还会延续到节后。实时跨渠道监测能够将短短一个惊悚之夜转变为做出明智决策的整个营销季。

我们所研究的每个市场中,OTT与流媒体类应用的活跃度都大幅上升,但上升的日期各不相同。如果全球统一在同一天发送,至少会错过其中一个市场。可以借助Adjust,查看各个市场的安装量和会话量实际在哪一天达到峰值,并直接将预算转移到那一天。

万圣节当晚,照片与视频类应用的会话量大幅增长,随后在三、四天内回落至正常水平。Pulse提醒可以实时识别出现这种增长的信号;您可以借助受众群体功能,按市场划分当晚使用应用的用户群组,从而趁时机窗口尚未关闭时发送消息。

TrueLink随后可以将该用户直接引导至专为那个夜晚打造的活动或促销活动。这在墨西哥这样的市场尤其有用,因为那里的活动会在万圣节后持续几天,并延续至亡灵节。可以借助Adjust的 AI解决方案,直接询问自己的推广活动,例如哪个市场刚开始出现激增,或者昨晚的安装中有多少今天显示为会话,然后即可获得明确答复。

想要了解Adjust如何助力您的万圣节推广活动,欢迎发送邮件至china-marketing@adjust.com与我们的专家取得联系。

关于Adjust

Adjust是 AppLovin(纳斯达克代码:APP) 旗下公司,旨在帮助海量应用实现从移动端到CTV等多平台的监测和增长,深受全球营销者的信赖。无论是快速增长的数字品牌,还是试水应用领域的实体公司,Adjust都能为其应用营销旅程保驾护航。Adjust强大的监测与分析套件能够为营销人员提供营销必备工具,助力其业务增长。

注:文/龚作仁,文章来源:Laborer,本文为作者独立观点,不代表亿邦动力立场。

文章来源:Laborer

广告
微信
朋友圈

FAQ回顾

万圣节期间哪些类型的移动应用安装量和会话量增长最明显?

流媒体类应用表现最亮眼:2025年10月25日单日,OTT、流媒体与视频内容类应用安装量高于夏季基准线120%,并实现300%的同比增长。娱乐类应用安装量在节前周末最强,10月25日增长42%、10月26日增长44%,同比分别增长130%和100%。照片与视频类应用会话量则在万圣节当天达到峰值,全球平均增长6%,加拿大、德国、英国分别为15%、13%、11%。

万圣节营销应该从什么时候开始筹备?

数据显示万圣节相关内容查看量在节前数月稳步攀升:7月至8月增长22%,9月增长25%,10月增长58%。NRF调查显示,49%的美国消费者会在10月之前开始筹备,高于十年前的34%;74%的人计划参与庆祝活动。Adjust数据也显示娱乐类应用安装量在万圣节前一个周末(10月25日至26日)达到峰值,因此营销窗口应提前至9月甚至更早开启。

不同国家市场的万圣节应用增长高峰有何差异?

流媒体类应用安装高峰因市场而异:美国和英国均在10月25日达到峰值,增幅分别为370%和354%;德国最大增幅出现在10月26日,为137%;加拿大10月25日跃升至342%,11月2日更达到537%。照片与视频类应用会话量在万圣节当天,加拿大、德国、英国、美国、墨西哥分别增长15%、13%、11%、9%和7%。墨西哥因亡灵节延续,会话高峰持续至11月1日至2日。

美国万圣节消费趋势有哪些变化?

根据美国全国零售联合会(NRF)的调查,今年计划参与万圣节庆祝活动的人占74%,高于疫情前的68%;49%的消费者表示会在10月之前开始筹备,高于十年前的34%。美国万圣节消费额预计将达到创纪录的135亿美元,高于去年的131亿美元。NRF还将看恐怖片列为美国人庆祝万圣节的主要方式之一,占比42%,与雕刻南瓜并列。

营销人员如何实时把握万圣节期间各市场的应用增长时机?

可以借助Adjust的实时跨渠道监测查看各市场安装量和会话量的实际峰值日期,并将预算直接转移到那一天。Pulse提醒能实时识别增长信号,受众群体功能可按市场划分当晚使用应用的用户群组,TrueLink可将用户引导至专为当晚打造的活动或促销。Adjust的AI解决方案还能直接询问推广活动,例如哪个市场刚开始出现激增,并获得明确答复。

这么好看,分享一下?

朋友圈 分享

APP内打开

赞 +1
+1
微信好友 朋友圈 新浪微博 QQ空间
关闭
收藏成功
发送
/140 0